Methods
what each technique can see| Technique | Detects | Depth reached | Flown on |
|---|---|---|---|
| Reflectance spectroscopy · UV to near-IR | Pyroxene, olivine, plagioclase, spinel, Fe and Ti oxides, OH / H₂O | Top microns | Clementine, Kaguya, M³, LROC WAC, IIRS |
| Thermal infrared | Silica content, surface temperature, cold traps | Top millimetres | LRO Diviner |
| Gamma-ray spectroscopy | Th, K, U, Fe, Ti | ~30 cm | Apollo 15–16, Lunar Prospector, Kaguya, Danuri |
| Neutron spectroscopy | Hydrogen | ~1 m | Lunar Prospector, LRO LEND |
| X-ray fluorescence | Mg, Al, Si, Ca, Fe, Na | Top microns | Apollo 15–16, SMART-1, Chandrayaan-1 and -2 |
| Radar · imaging and sounding | Ice candidates, buried voids, layer boundaries | Metres to kilometres | Mini-SAR, Mini-RF, Kaguya LRS, DFSAR |
| Gravity gradiometry | Missing mass · empty tubes | Kilometres | GRAIL |
| High-resolution imaging | Pits, overhangs, collapsed channels | Surface | Lunar Orbiter, Kaguya TC, LROC NAC |
| In situ and returned samples | Exact mineralogy, ages, isotopes, water content | Up to 3 m (Apollo drill cores) | Surveyor, Apollo, Luna, Chang'e, Chandrayaan-3 |
Minerals
1966 – 2026- 1969–72 · Apollo 11–17
382 kg of rock and soil from six nearside sites.
- Apollo result
Highlands are anorthosite (calcium-rich plagioclase); maria are basalt (pyroxene, plagioclase, olivine, ilmenite). This is the evidence for a global magma ocean.
- Apollo result
Three minerals first described from lunar samples: armalcolite, tranquillityite, pyroxferroite.
- Apollo result
KREEP identified: material rich in potassium, rare-earth elements and phosphorus, the last liquid of the magma ocean.
- 1970–76 · Luna 16, 20, 24
About 300 g returned robotically from three eastern nearside sites.
- 2020 · Chang'e-5
1,731 g from Oceanus Procellarum. Basalts dated to about 2.0 billion years, the youngest returned so far.
- 2022 · Chang'e-5
Changesite-(Y), a new phosphate mineral, approved as the sixth mineral discovered on the Moon.
- 2024 · Chang'e-6
1,935.3 g from the South Pole–Aitken basin: the first samples from the farside. Source
- 2024–25 · Chang'e-6
Farside volcanism dated at 4.2 and 2.8 billion years; basalt source mantle holds 1–1.5 µg/g water, drier than the nearside. Source
- 1960s–70s · Telescopes
Visible and near-infrared reflectance spectra separate high-titanium from low-titanium maria before any global orbiter.
- 1971–72 · Apollo 15, 16
Orbital X-ray and gamma-ray spectrometers map Al/Si, Mg/Si and thorium along the equatorial ground tracks.
- 1990, 1992 · Galileo
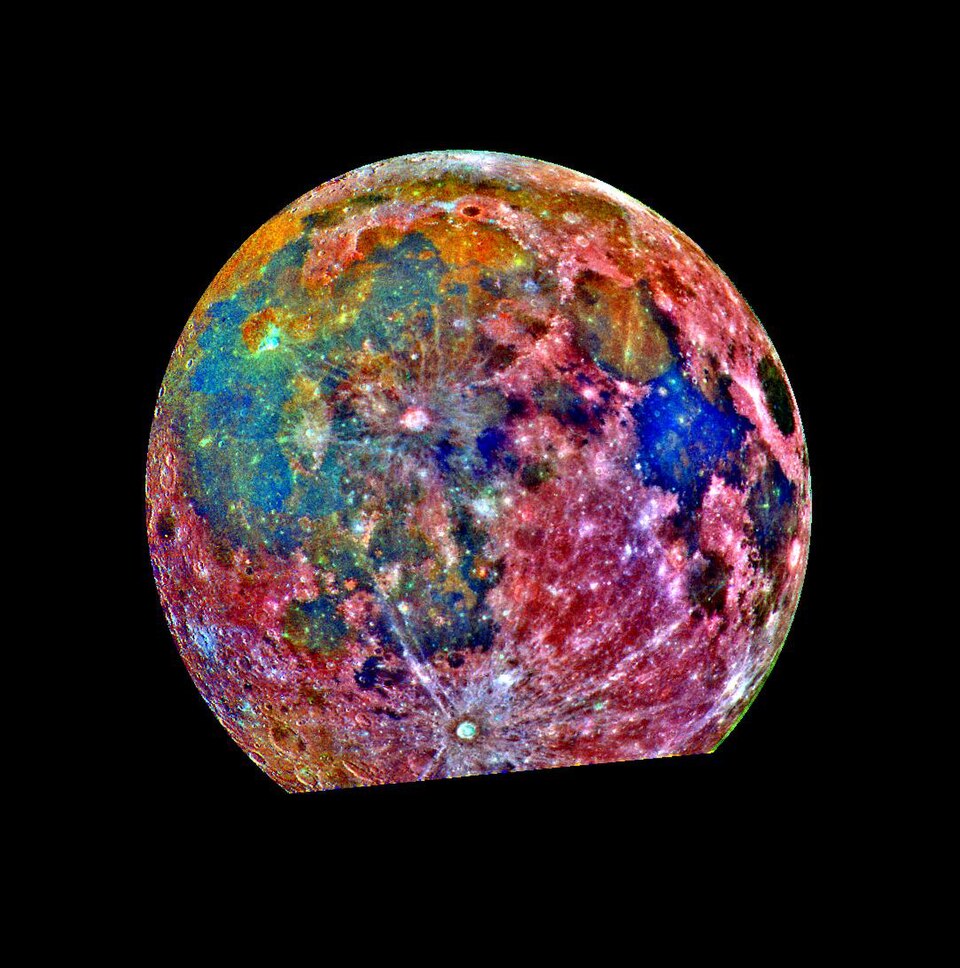
Multispectral flyby images show the South Pole–Aitken basin as an iron-rich anomaly on the farside.
- 1994 · Clementine
First global multispectral map: 11 bands from ultraviolet to near-infrared at 100–200 m per pixel. First global iron and titanium oxide maps.
- 1998–99 · Lunar Prospector
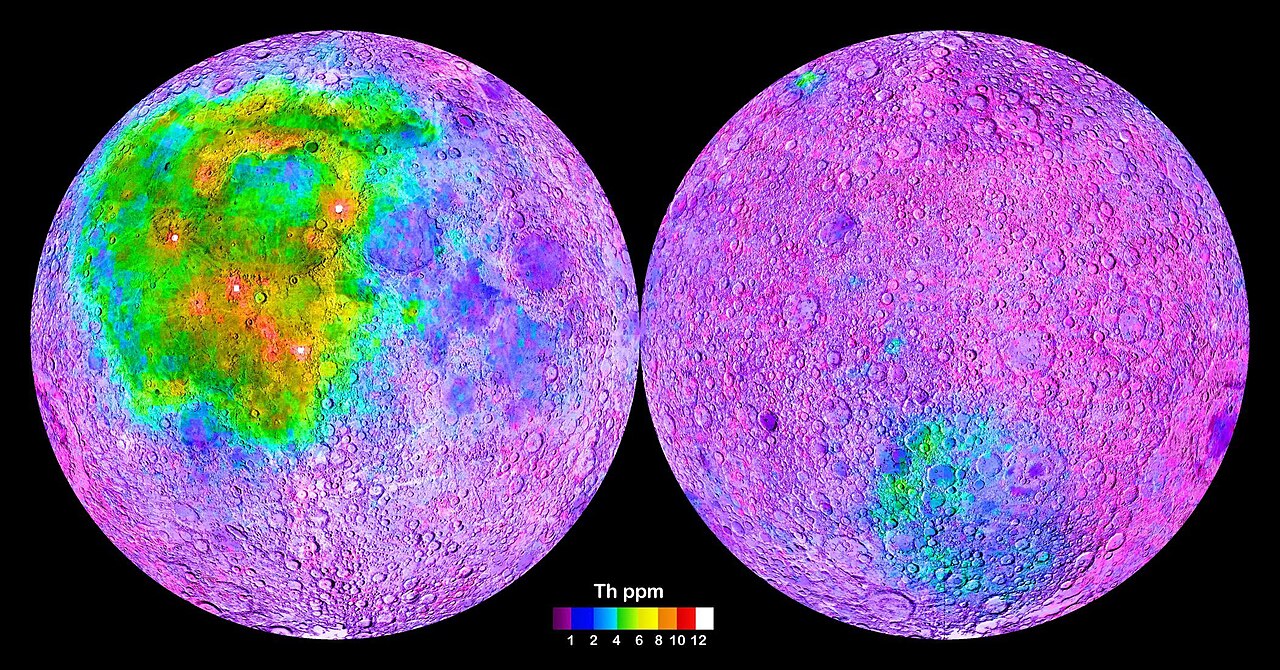
Gamma-ray spectrometer maps thorium, potassium and iron globally. Thorium concentrates in one nearside region, the Procellarum KREEP Terrane.
- 2003–06 · SMART-1
Compact X-ray spectrometer D-CIXS measures Mg, Al, Si, Ca and Fe during solar flares.
- 2007–09 · Kaguya
Multiband Imager and Spectral Profiler find pure anorthosite (over 98% plagioclase) in crater central peaks across the highlands.
- 2007–09 · Kaguya
Olivine-rich exposures located around large impact basins; gamma-ray spectrometer produces the first global uranium map.
- 2007–09 · Chang'e-1
First microwave radiometer in lunar orbit; brightness temperatures used to estimate regolith thickness and the helium-3 inventory.
- 2008–09 · Chandrayaan-1 M³
Moon Mineralogy Mapper: 85 bands, 0.43–3.0 µm, 140 m per pixel, near-global. The reference mineral map still in use.
- 2011 · M³ result
New rock type identified from orbit: magnesium-spinel anorthosite, never found in the sample collection.
- 2009– · LRO Diviner
Thermal infrared maps silicate composition. Silica-rich, granite-like volcanic domes confirmed at Gruithuisen and Compton–Belkovich.
- 2009– · LROC WAC
Seven-band camera (321–689 nm) yields a titanium dioxide map of the maria at about 400 m per pixel.
- 2019– · Chandrayaan-2
CLASS X-ray spectrometer produces the first global sodium map; IIRS extends spectra to 5 µm.
- 2022– · Danuri
Korean orbiter carries a gamma-ray spectrometer and ShadowCam, which images inside permanently shadowed craters.
- 1967–68 · Surveyor 5, 6, 7
Alpha-scattering instruments make the first chemical analyses on the Moon: maria are basaltic, highlands aluminium-rich.
- 1970–73 · Lunokhod 1, 2
Rover-mounted X-ray fluorescence spectrometers measure soil chemistry along the traverses.
- 2013 · Chang'e-3
Yutu rover (X-ray and infrared spectrometers) finds a young basalt type in Mare Imbrium unlike any returned sample.
- 2019– · Chang'e-4
Yutu-2, first rover on the farside, detects olivine and low-calcium pyroxene in Von Kármán crater, possibly excavated from the mantle.
- 2023 · Chandrayaan-3
Pragyan rover at 69° S: laser spectrometer confirms sulfur in situ, with Al, Ca, Fe, Cr, Ti, Mn, Si and O. Source
Water and volatiles
the most-tracked resource- 1994 · Clementine
Bistatic radar experiment suggests ice near the south pole. Result contested.
- 1998 · Lunar Prospector
Neutron spectrometer detects excess hydrogen at both poles.
- 1999 · Lunar Prospector
Deliberate crash into a south-polar crater. No water detected in the plume.
- 2009 · M³, Cassini, Deep Impact
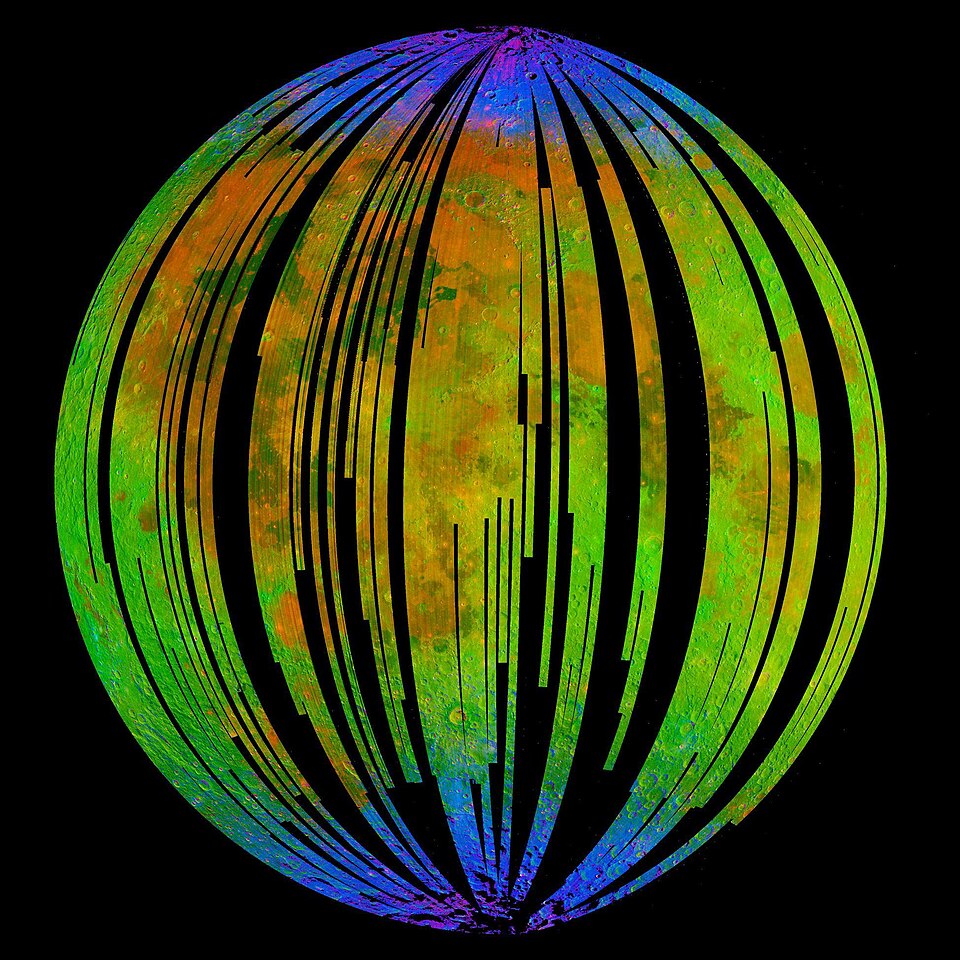
Three spacecraft see the 2.8–3.0 µm absorption of OH / H₂O across the sunlit surface, strongest at high latitude.
- 2009 · LCROSS
Impactor strikes the permanently shadowed crater Cabeus. Ejecta contain 5.6 ± 2.9% water by mass, plus CO, H₂S, NH₃ and mercury. Source
- 2009– · Mini-SAR, Mini-RF
Radar finds polar craters with ice-like polarisation. Rough rock gives the same signal; ambiguous.
- 2018 · M³ reanalysis
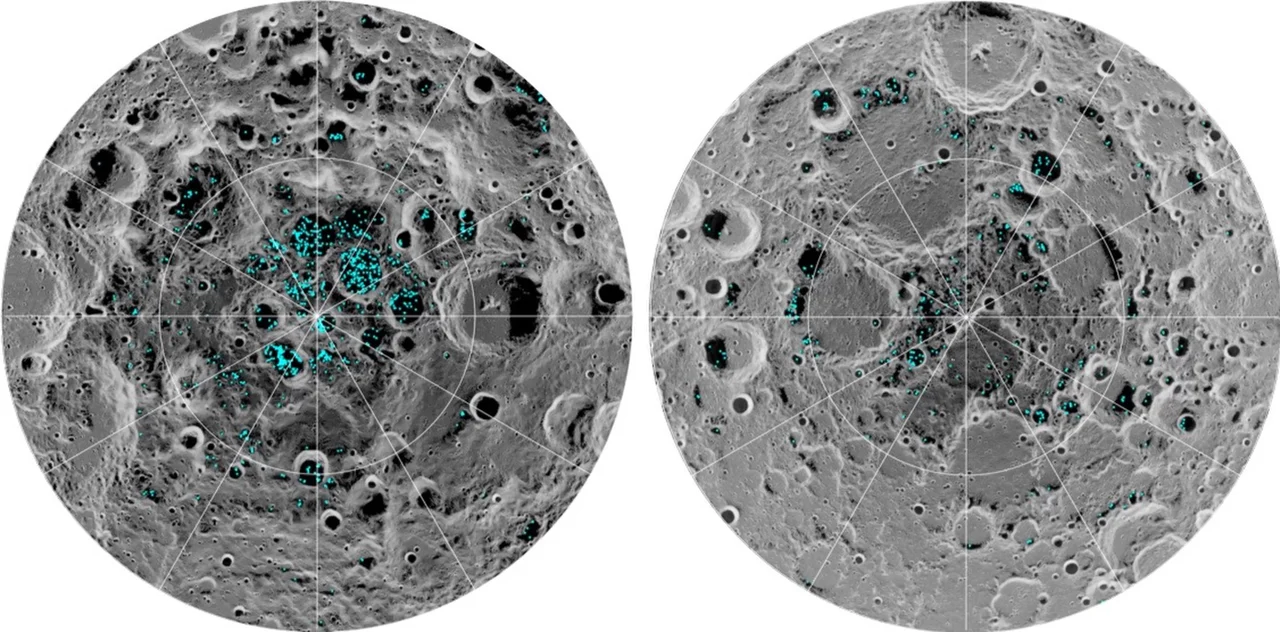
First direct detection of surface ice: near-infrared ice absorptions in permanently shadowed craters within 20° of both poles, in about 3.5% of cold traps. Source
- 2020 · SOFIA
Airborne telescope detects molecular H₂O at 6 µm in sunlit soil at Clavius: 100–412 ppm. Source
- 2023 · Chang'e-5 samples
Impact glass beads in the soil hold solar-wind-derived water.
- 2022–23 · LunaH-Map, Lunar Flashlight
Two NASA cubesats built to map polar hydrogen and ice. Failed · propulsion faults, neither reached lunar orbit.
- 2025 · PRIME-1 on IM-2
First ice-drilling attempt. Lander came to rest on its side on 6 March; the drill moved through its full range but never reached soil. Not achieved Source
- 2025 · Lunar Trailblazer
Orbiter built to map the form and abundance of water. Contact lost a day after launch; mission ended 31 July 2025. Lost
Caves
pits and lava tubes- 1966–67 · Lunar Orbiter
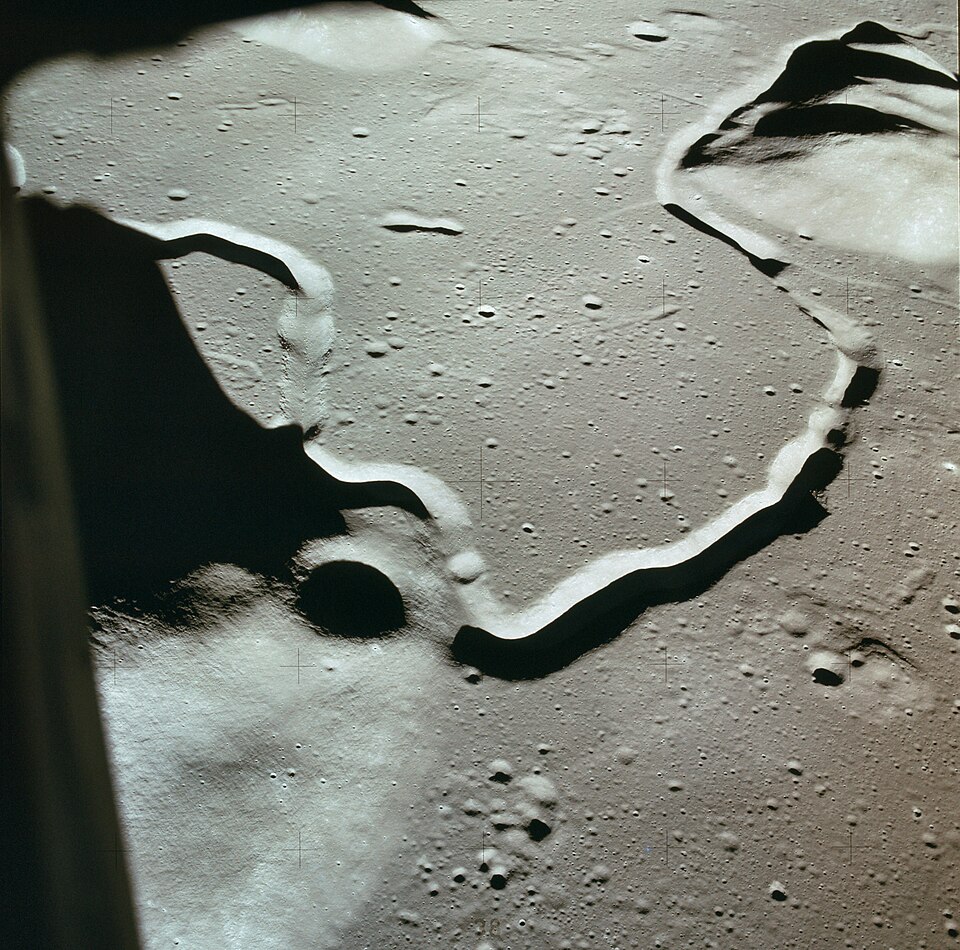
Photographs of sinuous rilles lead to the hypothesis that they are lava channels and collapsed lava tubes.
- 1971 · Apollo 15
Astronauts reach the edge of Hadley Rille, about 1.5 km wide and 300 m deep, and photograph layered basalt in its wall.
- 2009 · Kaguya
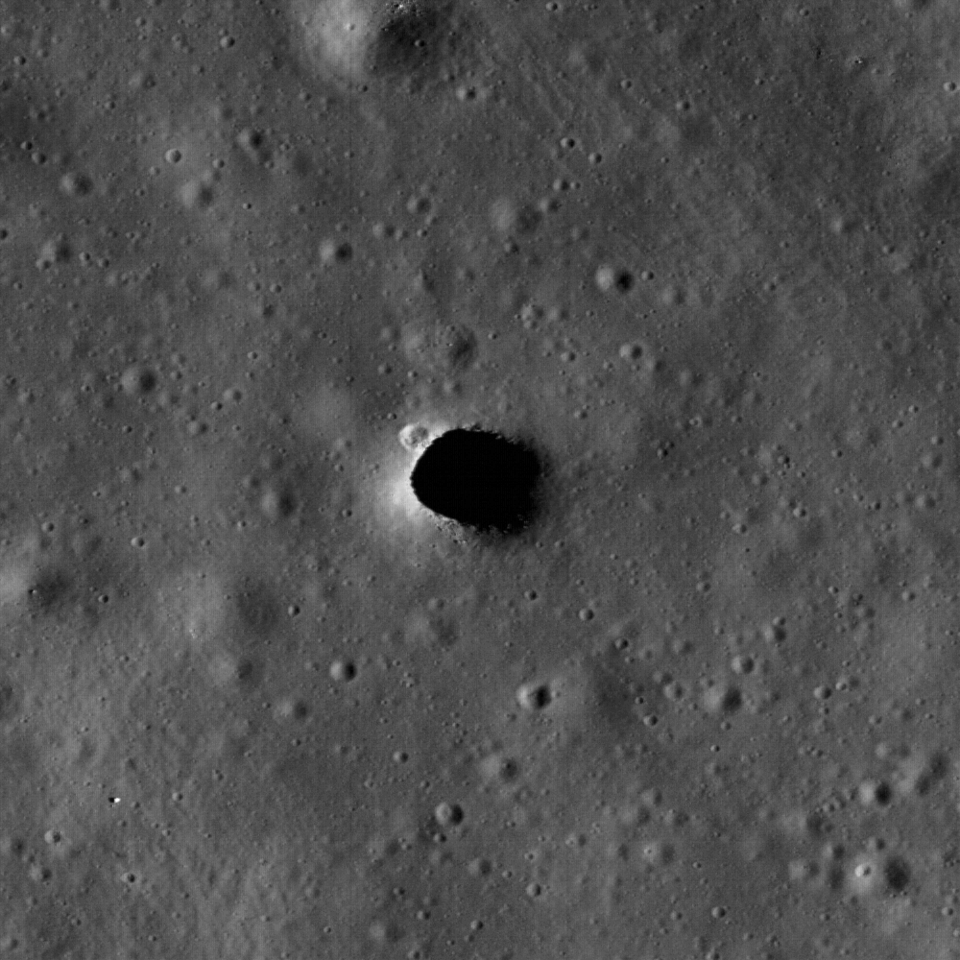
Terrain Camera finds the Marius Hills Hole, the first known skylight: a vertical pit about 65 m across in a rille.
- 2009–10 · Kaguya
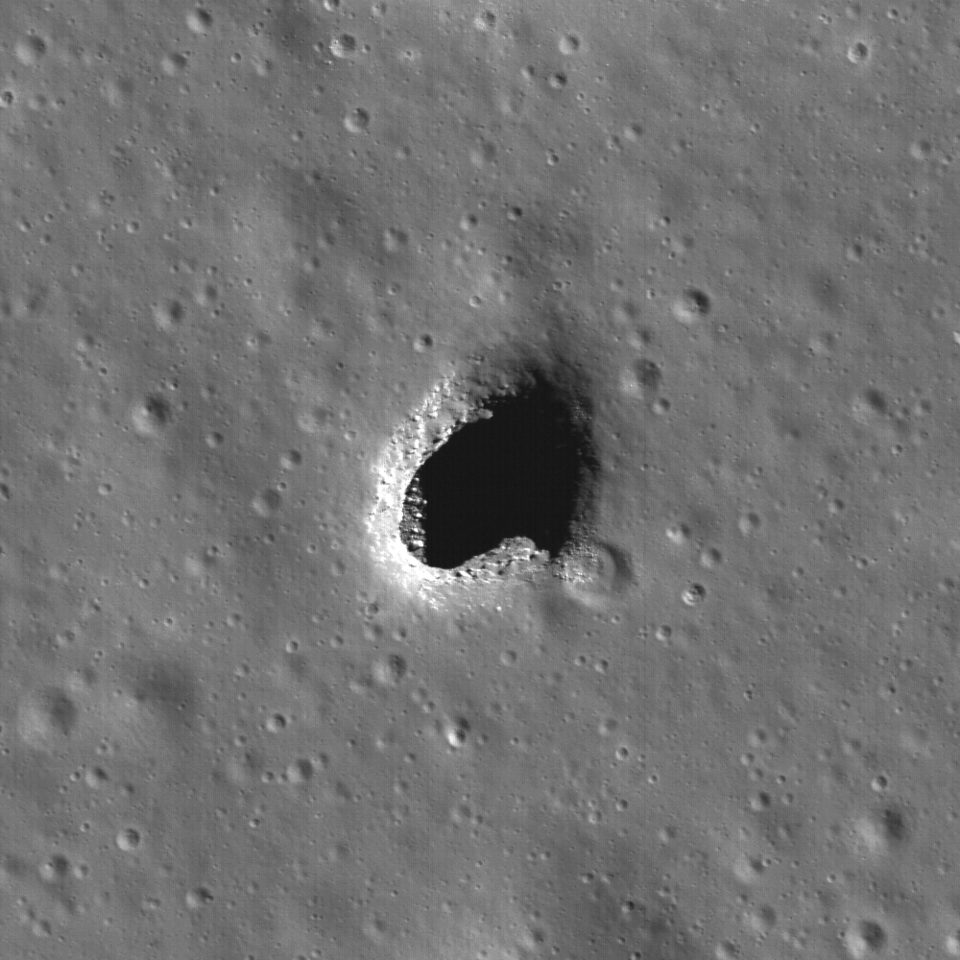
Two more pits found, in Mare Tranquillitatis and Mare Ingenii. Source
- 2010–12 · LROC NAC
0.5 m per pixel images taken at an angle show layered walls and floors that continue under the rim: overhangs of 20 m and more.
- 2014 · LROC NAC
Automated search of the image archive finds over 200 pits. Most are in impact-melt ponds; under ten are in mare lava.
- 2021 · LROC
Lunar Pit Atlas published: 281 pits with position, size and depth. Source
- 2017 · GRAIL
Gravity gradients show long, narrow mass deficits under the maria, consistent with buried empty tubes over 1 km wide. Source
- 2017 · Kaguya radar
Lunar Radar Sounder records a double echo (roof, then floor) near the Marius Hills Hole, matching a GRAIL mass deficit. Indicated tube length: tens of kilometres. Source
- 2017 · Modelling
Structural analysis: in lunar gravity a lava tube could stay standing at widths of kilometres.
- 2022 · LRO Diviner
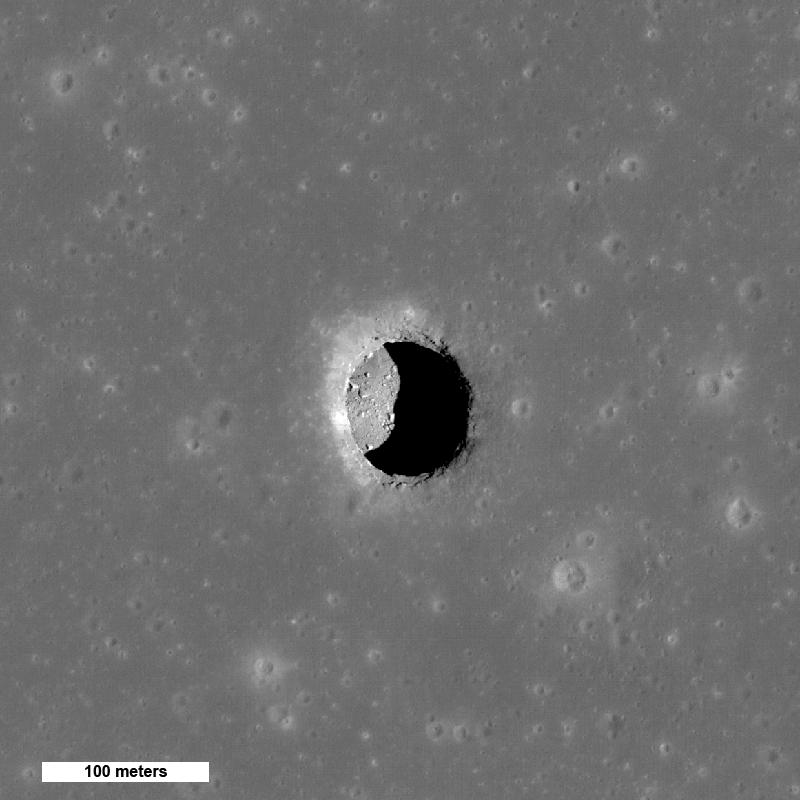
Shaded floor of the Mare Tranquillitatis pit holds near 17 °C through the lunar day. Open surface swings from 127 °C to −173 °C. Source
- 2024 · LRO Mini-RF
Reanalysis of 2010 radar images: a conduit leaves the Mare Tranquillitatis pit at 130–170 m depth, 30–80 m long and about 45 m wide. First radar evidence of an accessible cave. Source
- 2025 · Machine learning
Deep-learning search of orbital images reports new candidate cave entrances beyond the atlas. Source
- Status
No spacecraft has entered a lunar cave or imaged one from inside. Every tube detection is indirect. Unconfirmed
| Pit | Location | Opening | Depth | Evidence of a cave |
|---|---|---|---|---|
| Marius Hills | 14.09° N 303.23° E | ~58 × 49 m | ~40 m | Radar double echo, gravity deficit |
| Mare Tranquillitatis | 8.34° N 33.22° E | ~98 × 84 m | ~105 m | Overhang imaged, radar conduit |
| Mare Ingenii | 35.95° S 166.06° E | ~118 × 68 m | ~45–65 m | Overhang imaged |
Dimensions from LROC shadow measurements; published values differ by source and lighting.
Next
queued and proposed- GIMLI · NASA
Ground-penetrating radar, seismometers and a gravimeter on a commercial lander and rover at the Marius Hills pit, to settle whether it opens into a tube. No launch date. Selected Sep 2026 Source
- VIPER · NASA
Ice-prospecting rover with a 1 m drill for the south pole. Cancelled July 2024; reassigned to a Blue Origin lander. Late 2027 Source
- Chang'e-7 · CNSA
Orbiter, lander, rover and a hopper carrying a water analyser into a shadowed crater near Shackleton. August 2026 launch called off. Delayed to 2027 Source
- LunarLeaper · ESA candidate
Legged robot of about 15 kg with radar and gravimeter, to walk the ground above the Marius Hills tube. Not yet selected Source
- Moon Diver, Daedalus
Earlier concepts to lower a tethered rover (NASA JPL) or an instrumented sphere (ESA study) into a pit. Not funded
Sources
- Caves
LROC · mare pit craters · LROC · lunar atlases · JAXA · Kaguya radar, Marius Hills · Chappaz 2017 · GRAIL · NASA · Diviner pit temperatures · Carrer 2024 · Nature Astronomy · Eos · lava tube beneath pit · PSI · GIMLI · LunarLeaper · Acta Astronautica 2026
- Minerals and water
CAS · Chang'e-6 results · Chang'e-6 mantle water · Chandrayaan-3 sulfur · Li 2018 · surface ice · SOFIA · molecular water · LCROSS · IM-2 / PRIME-1 · NASA · VIPER · SpaceNews · Chang'e-7 delay
- Literature, no link
Entries without a source link rest on the published record: Pieters 2009 and Colaprete 2010 (Science), Ohtake 2009 (Nature), Haruyama 2009 (GRL), Robinson 2012 (PSS), Wagner & Robinson 2014 (Icarus), Lawrence 1998 and Feldman 1998 (Science), Sato 2017 (Icarus).
- Images
NASA, NASA/JPL, NASA/GSFC/Arizona State University, ISRO/NASA/JPL-Caltech/Brown University/USGS. Public domain, retrieved from Wikimedia Commons.